DesMOST - Complex Number Graphing
WELCOME TO DesMOST (test)
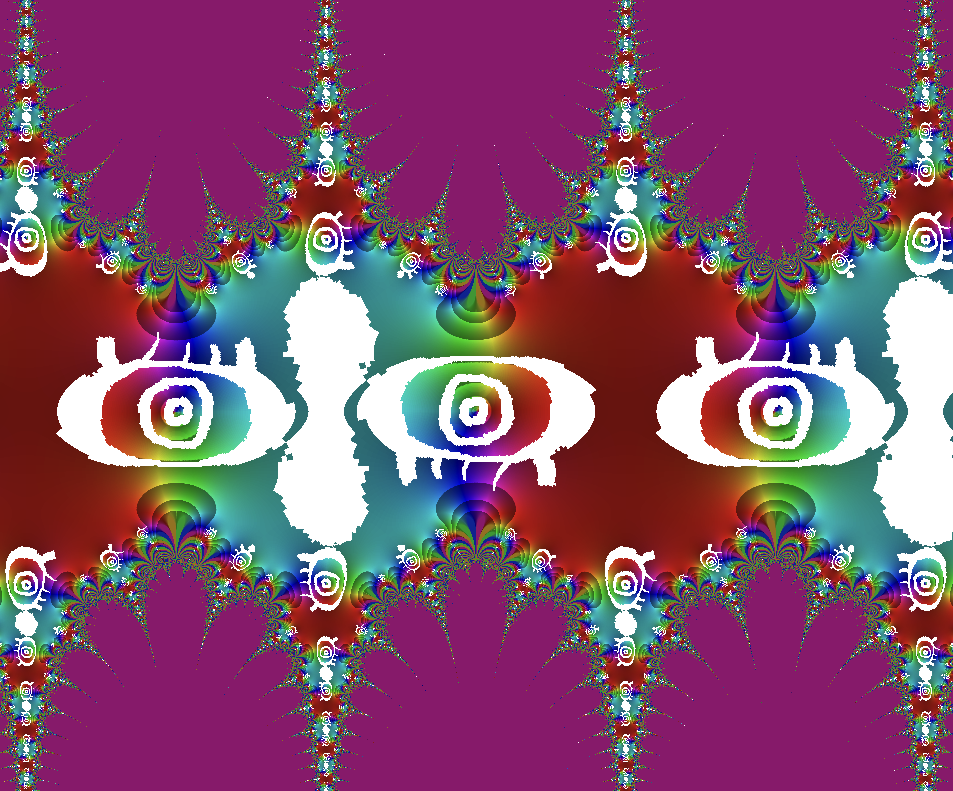
Have you ever wanted to plot complex functions? Draw and have your drawing transformed in real time? Easily see branch cuts? View Taylor and Laurent series in full 4-dimensional glory? Warp and twist images to your will? Well now you can.
DesMOST is my project to build Desmos, but for complex numbers. This is mostly to help myself with all the classes based around this fancy field of math, but also to help others if they want it.
Features
- Support for every simple complex function I could think of - trig functions, exponentials, logarithms, field operations, powers, roots, absolute value, argument, complex conjugate, and all compositions thereof (let me know if you come up with more I should add)
- Shader-based display so it doesn't take minutes to render (unlike some alternatives I could name)
- Drawing support - draw shapes in either of the windows and see how the mapping or inverse mapping transforms the drawing. (Eraser tool coming soon)
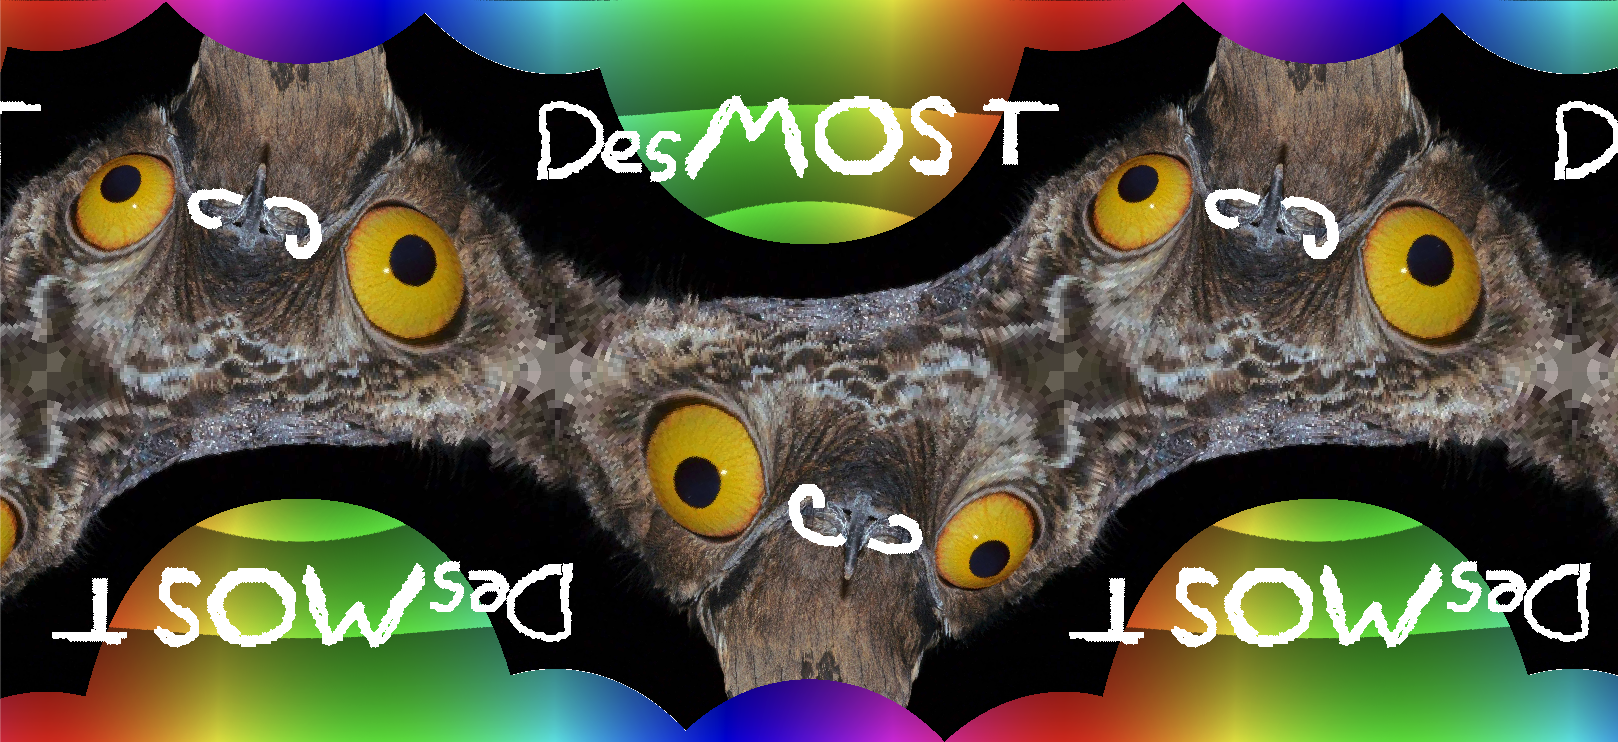
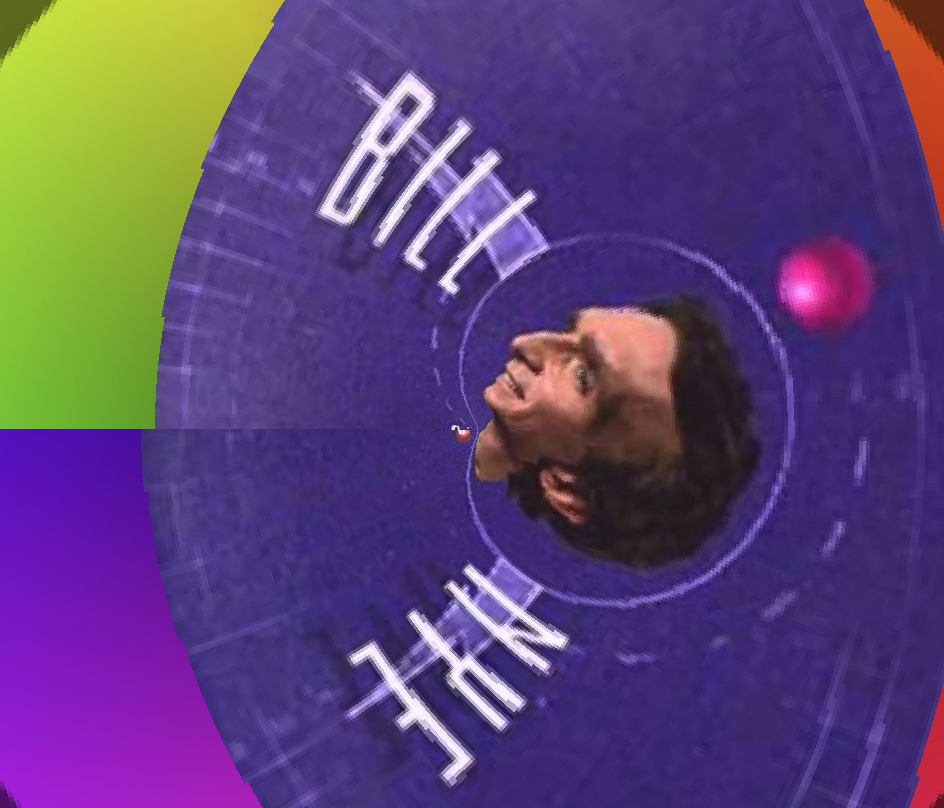
- Drag and drop images to see them warped by your complex mappings!
What the hell is this???
Rude of you to just barge in and ask without saying hello. I'll explain anyway though, cause I'm nice. Complex numbers are what you get when you ask "what number squared gives -1?" Now clearly, no real number does this, so we add a new "un-real" number "𝒾" with the property that "𝒾 * 𝒾 = -1".
This number, along with the usual field axioms of addition, subtraction, multiplication, and division lead to a super rich area of mathematics known as complex analysis. Results from this field allow for results ranging from super simple representations of waves, to the ability to calculate integrals analytically that are impossible otherwise.
Most of complex analysis deals with the behaviour of complex-valued functions, so you'd think plotting would be an essential tool of the field. Sadly, adding that 𝒾 increases both the input and output dimensions of your function by 1, meaning that to make a good plot, you need 4 dimensions, which my personal computer lacks. That's where this software comes in.
How do I use it?
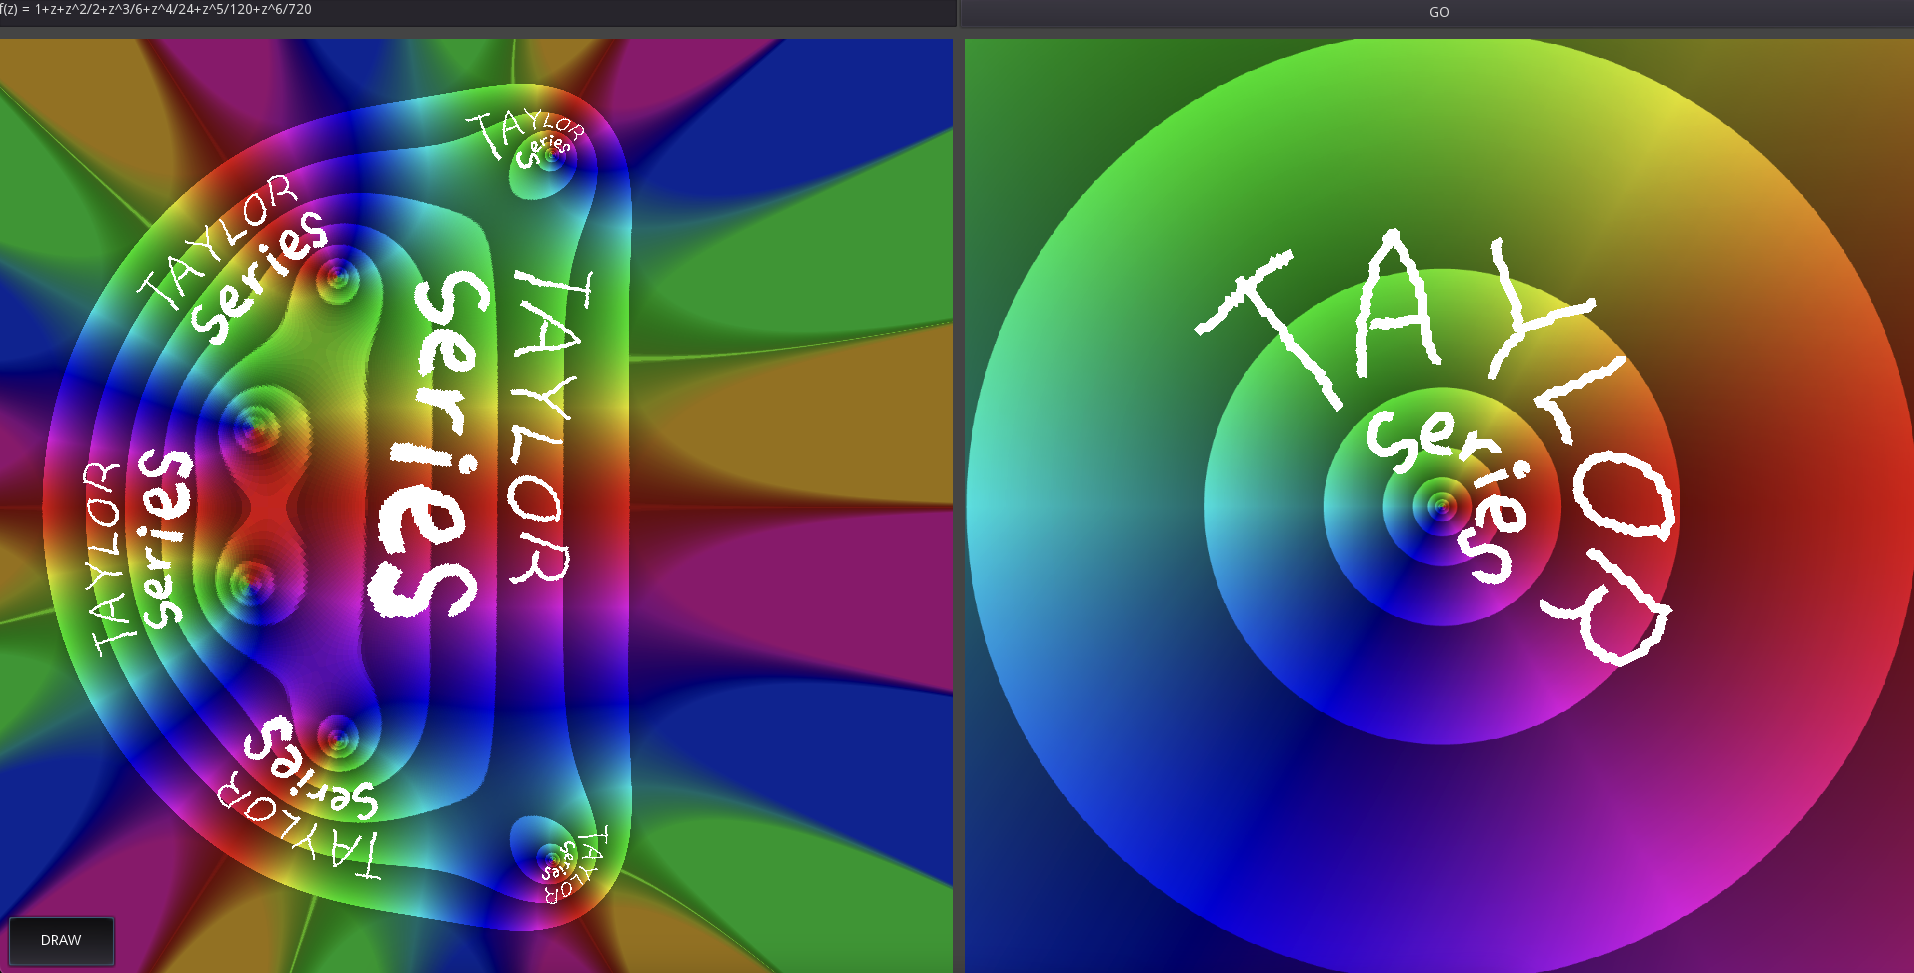
I'm glad you asked. Upon activating the program, you'll see a function bar, a "GO!" button, and two 2D rainbow squares.
In the function bar, feel free to type in any of your favourite functions of z. Could be sin(z), cos(z), e^z, ln(z), arg(z+2z^2), abs(sin(cos(tan(z)))). Once your function is typed in, click the "GO!" button. This should make the rainbow square on the left change (as long as you didn't choose to be boring and put in "z" as your favourite function).
What happened? Well, the square on the left is what you're inputting to f(z), while the square on the right is the output. The colours on the left get mapped to the same colour on the right. For example, if you have a red corner on the left, you know that corner is getting mapped by f(z) over to the middle right.
The number 0 is right where all the colours converge in the centre. Moving out to the right, you're moving in the positive real direction. The left is the negative real direction. Up is the positive 𝒾 direction, and down is the negative 𝒾 direction.
There is also a DRAW button. Click on this and you can start drawing in either rainbow square. The drawing will also show up in the other though, transformed by either f(z) or its inverse!
Finally, because it's fun, DesMOST supports dragging and dropping images into the rainbow square on the right. Once they're in there, you can use your mouse to move them around, hold R to rotate them, S to scale them, and hit BACKSPACE to delete them.
Leave a comment
Log in with itch.io to leave a comment.